Walkthrough — overview
Use this page in order. Media lives in assets/screen-shots and is served from /screen-shots/ on the docs site.
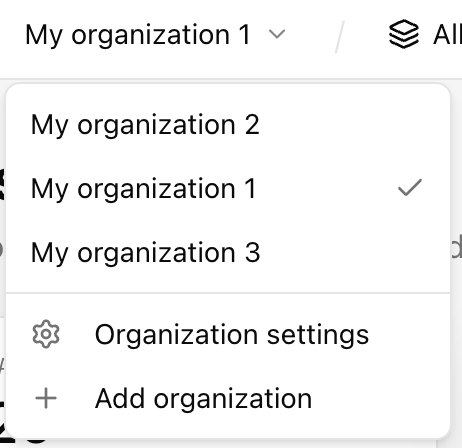
1. Sign in and land in an organization
Section titled “1. Sign in and land in an organization”You authenticate, then everything you see is scoped to one organization at a time. If you belong to several, you switch org from the header—data and settings follow that choice.
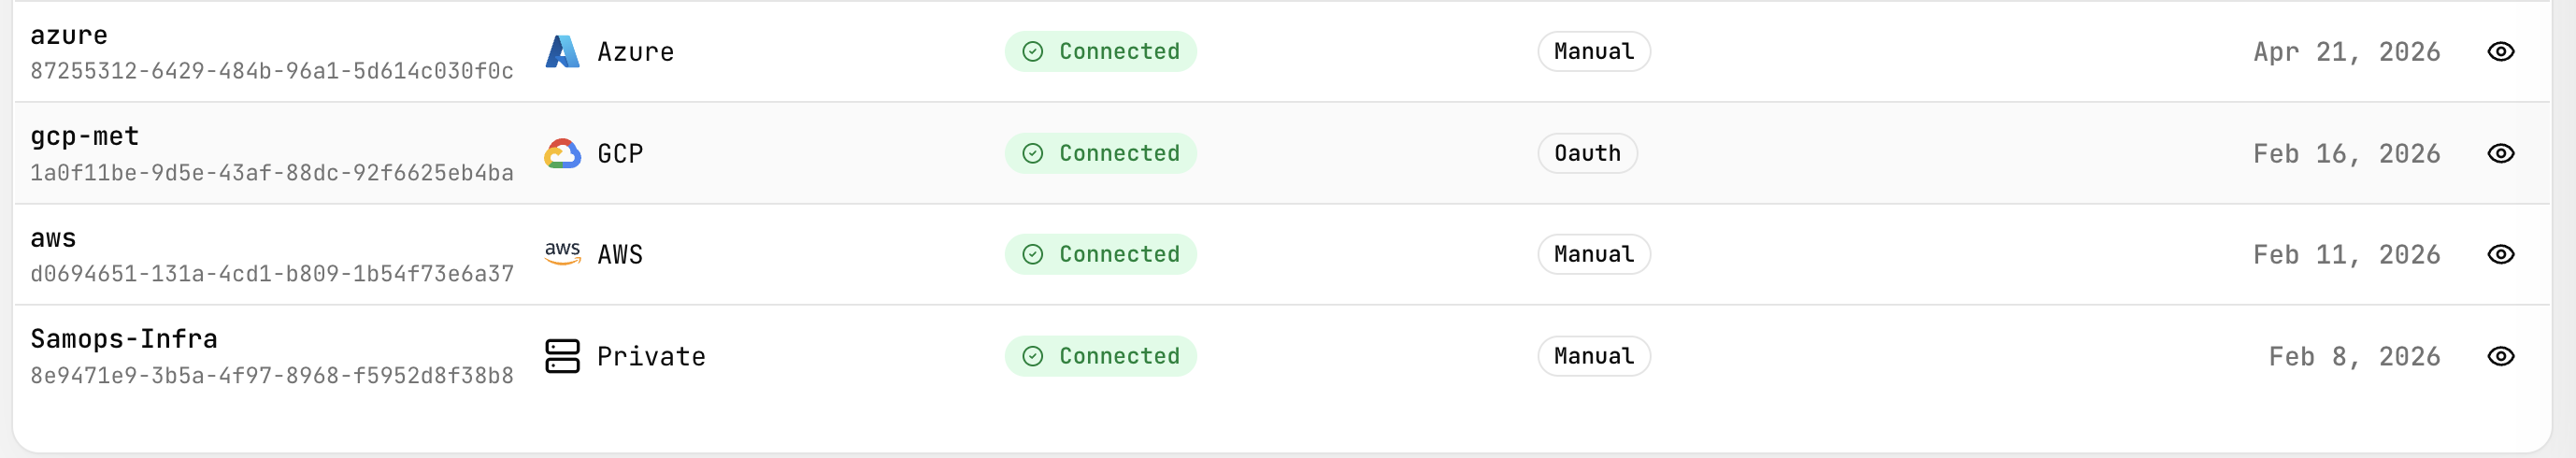
2. Connect the cloud (once per account)
Section titled “2. Connect the cloud (once per account)”Projects → Connectors is where billing and usage data come from. Finish setup until connectors show connected; otherwise charts stay empty or stale.
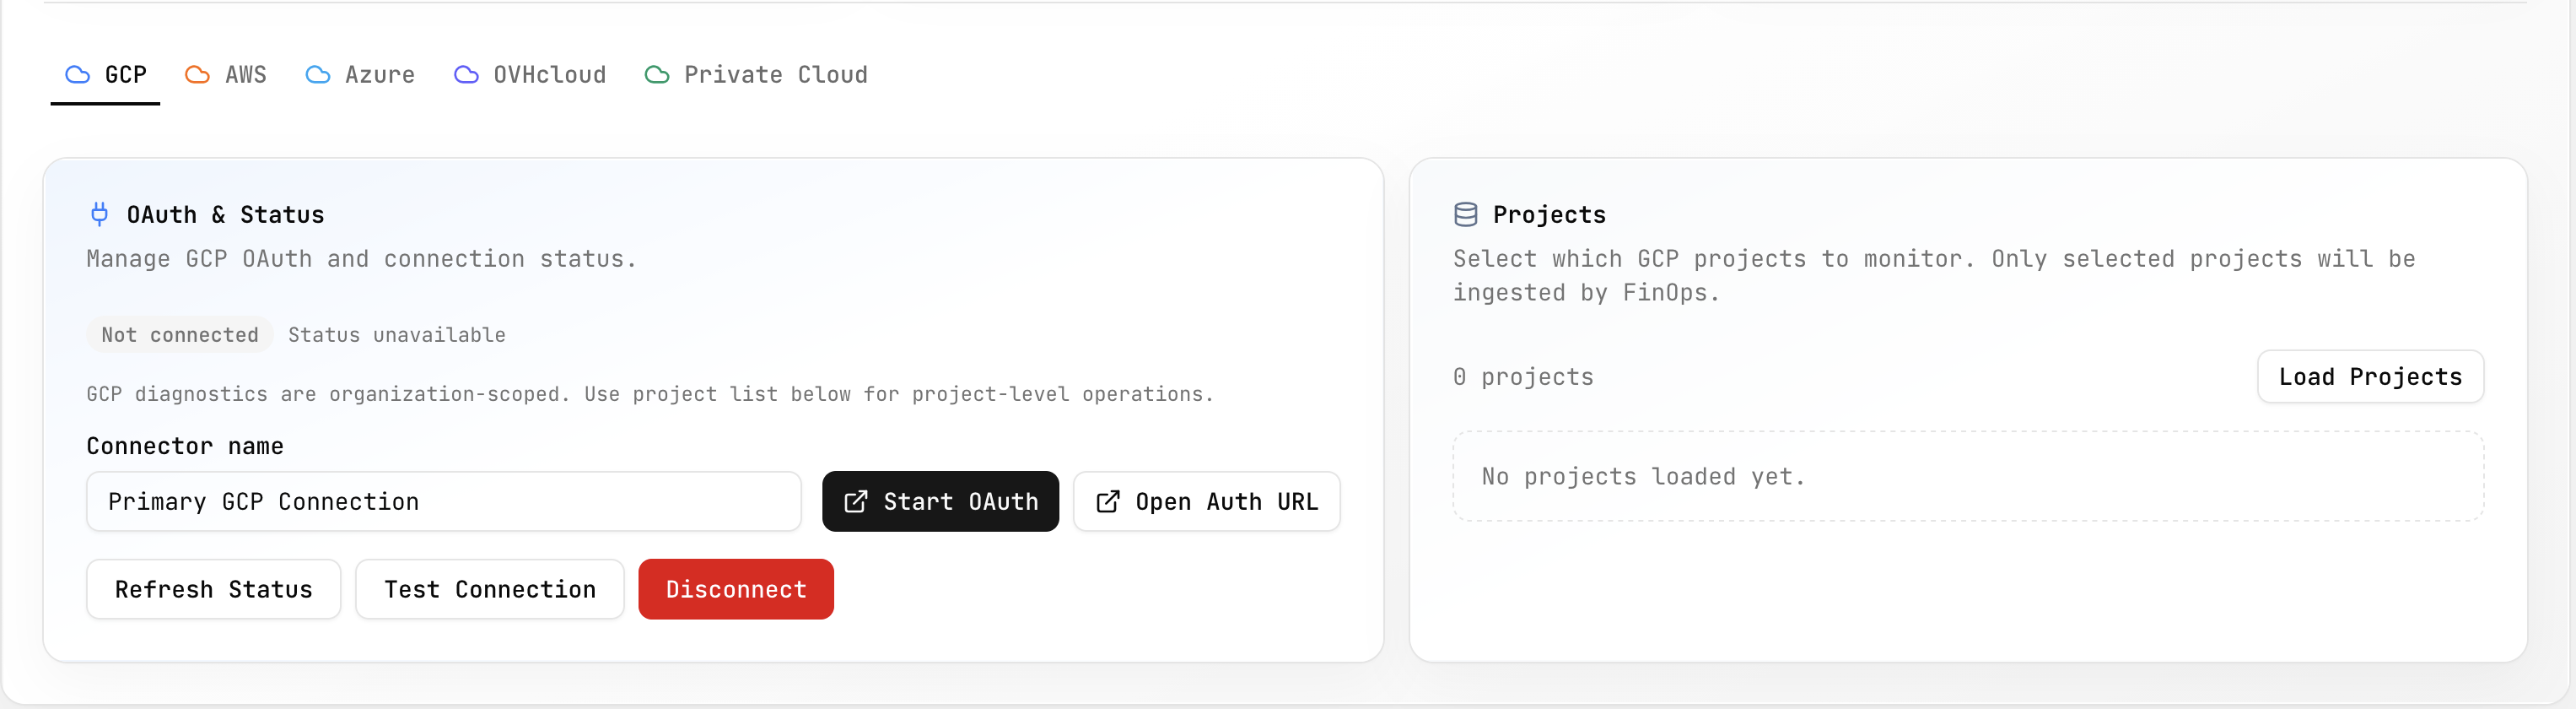
Flow: Add connector → complete provider flow (e.g. OAuth for GCP) → return to the app → confirm status on the list.
3. Pick what you’re looking at (scope)
Section titled “3. Pick what you’re looking at (scope)”On Dashboard, Metrics, Anomalies, Budgets, and similar pages, the app remembers which cloud account (and for GCP, which project) you’re focused on. That scope carries as you click around—so you’re not re-filtering every screen.

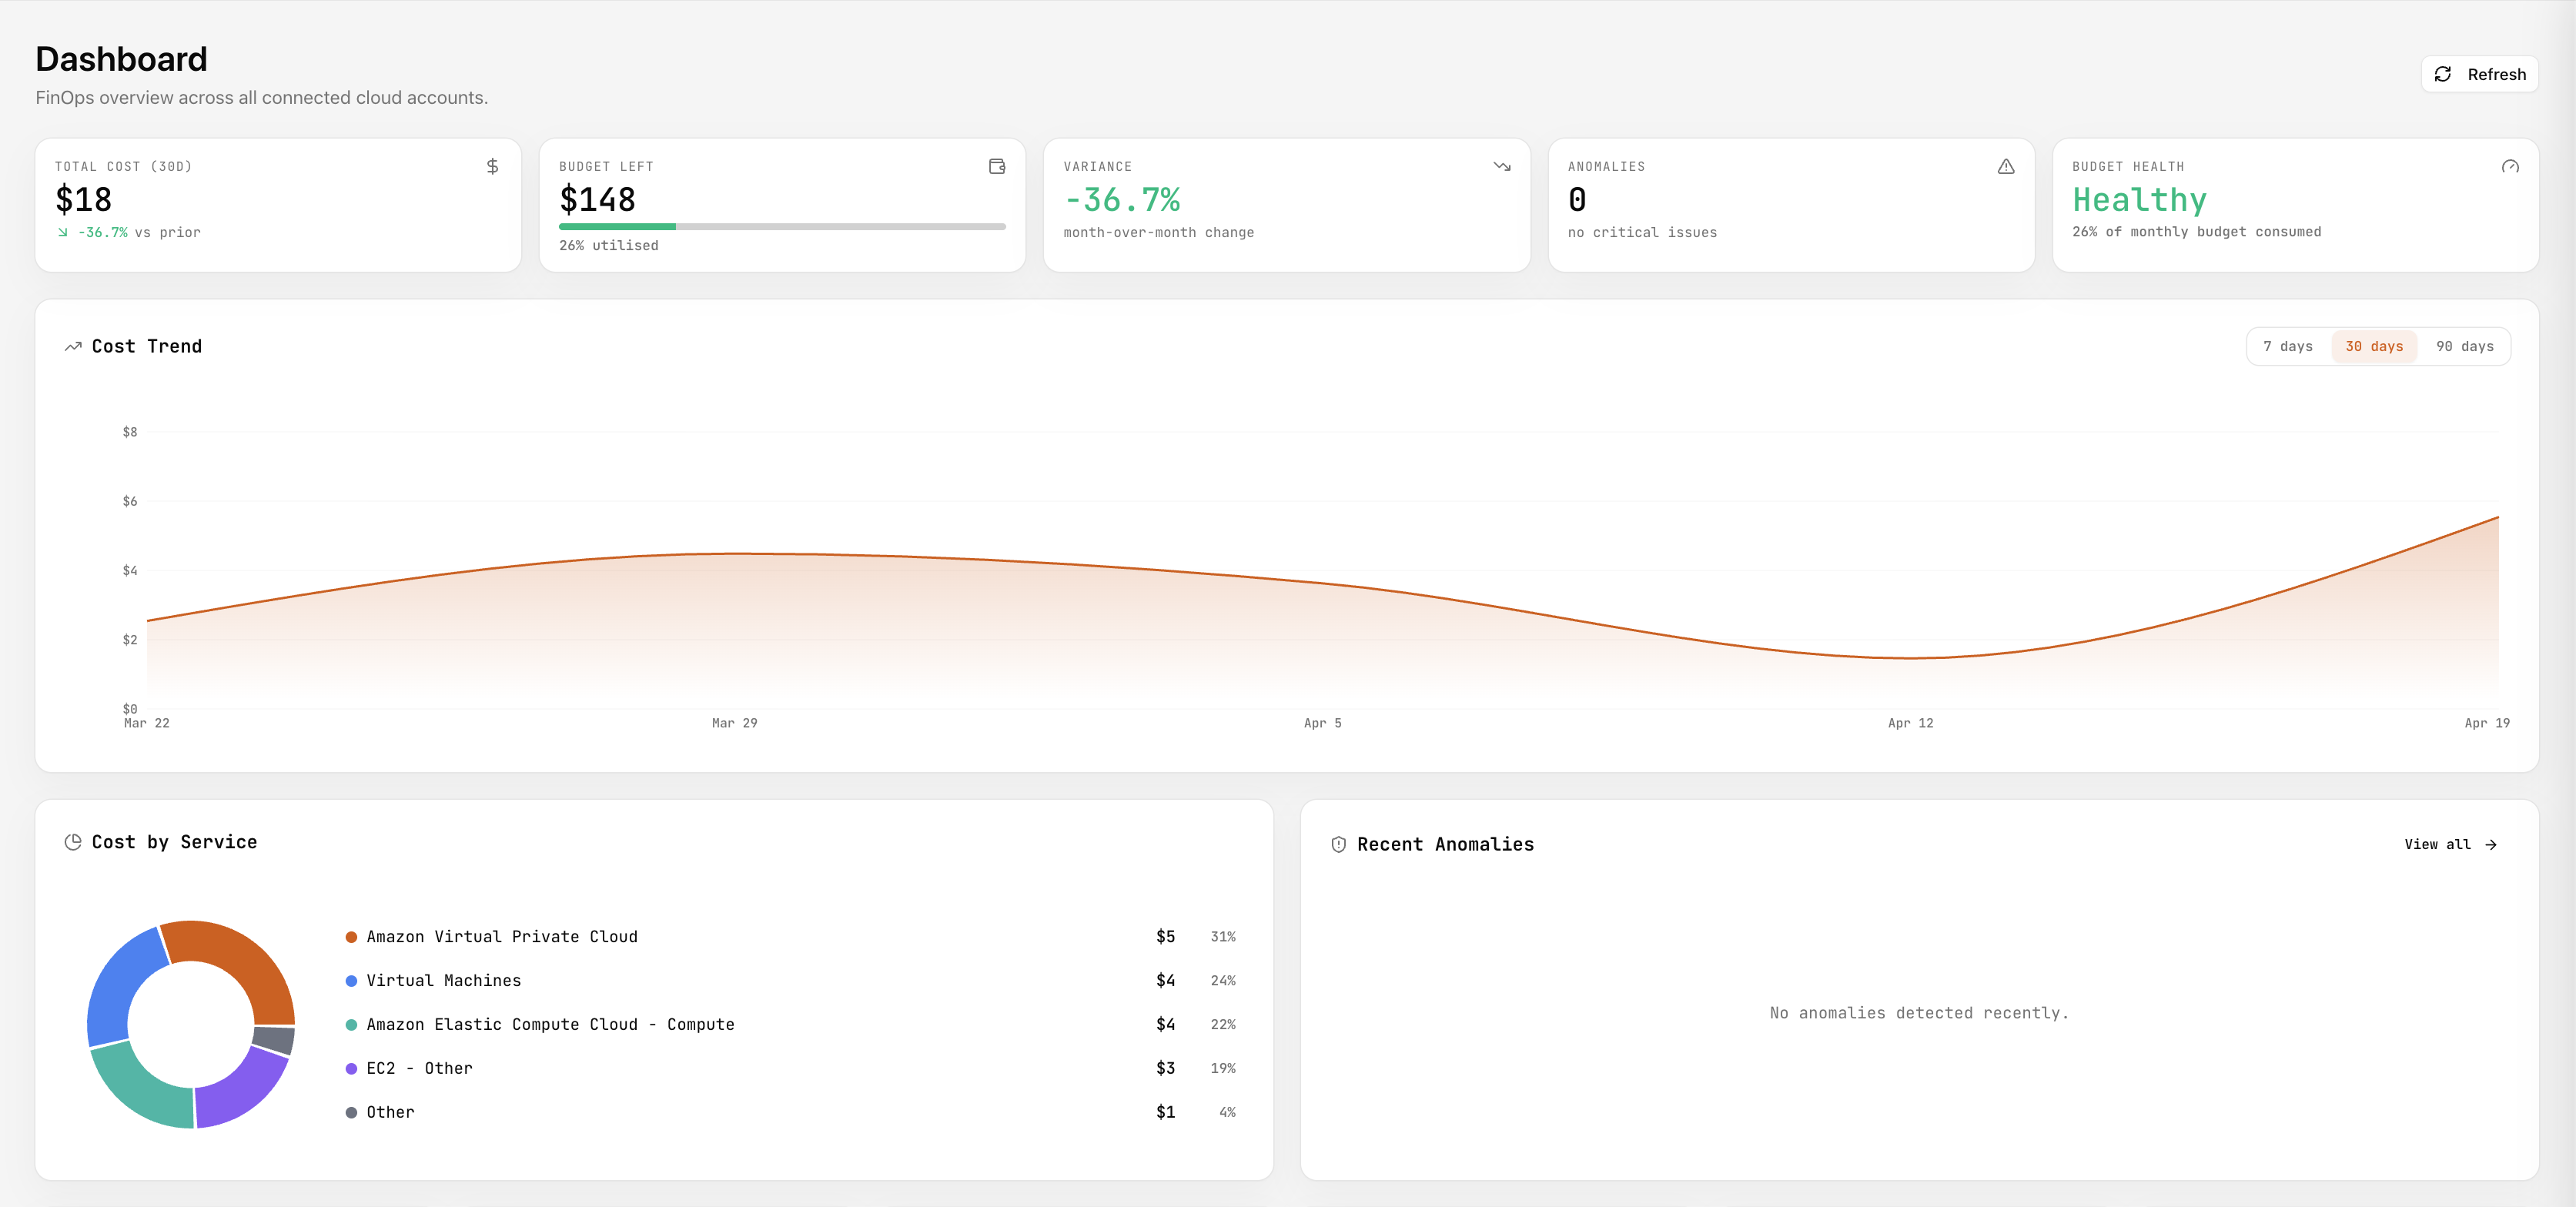
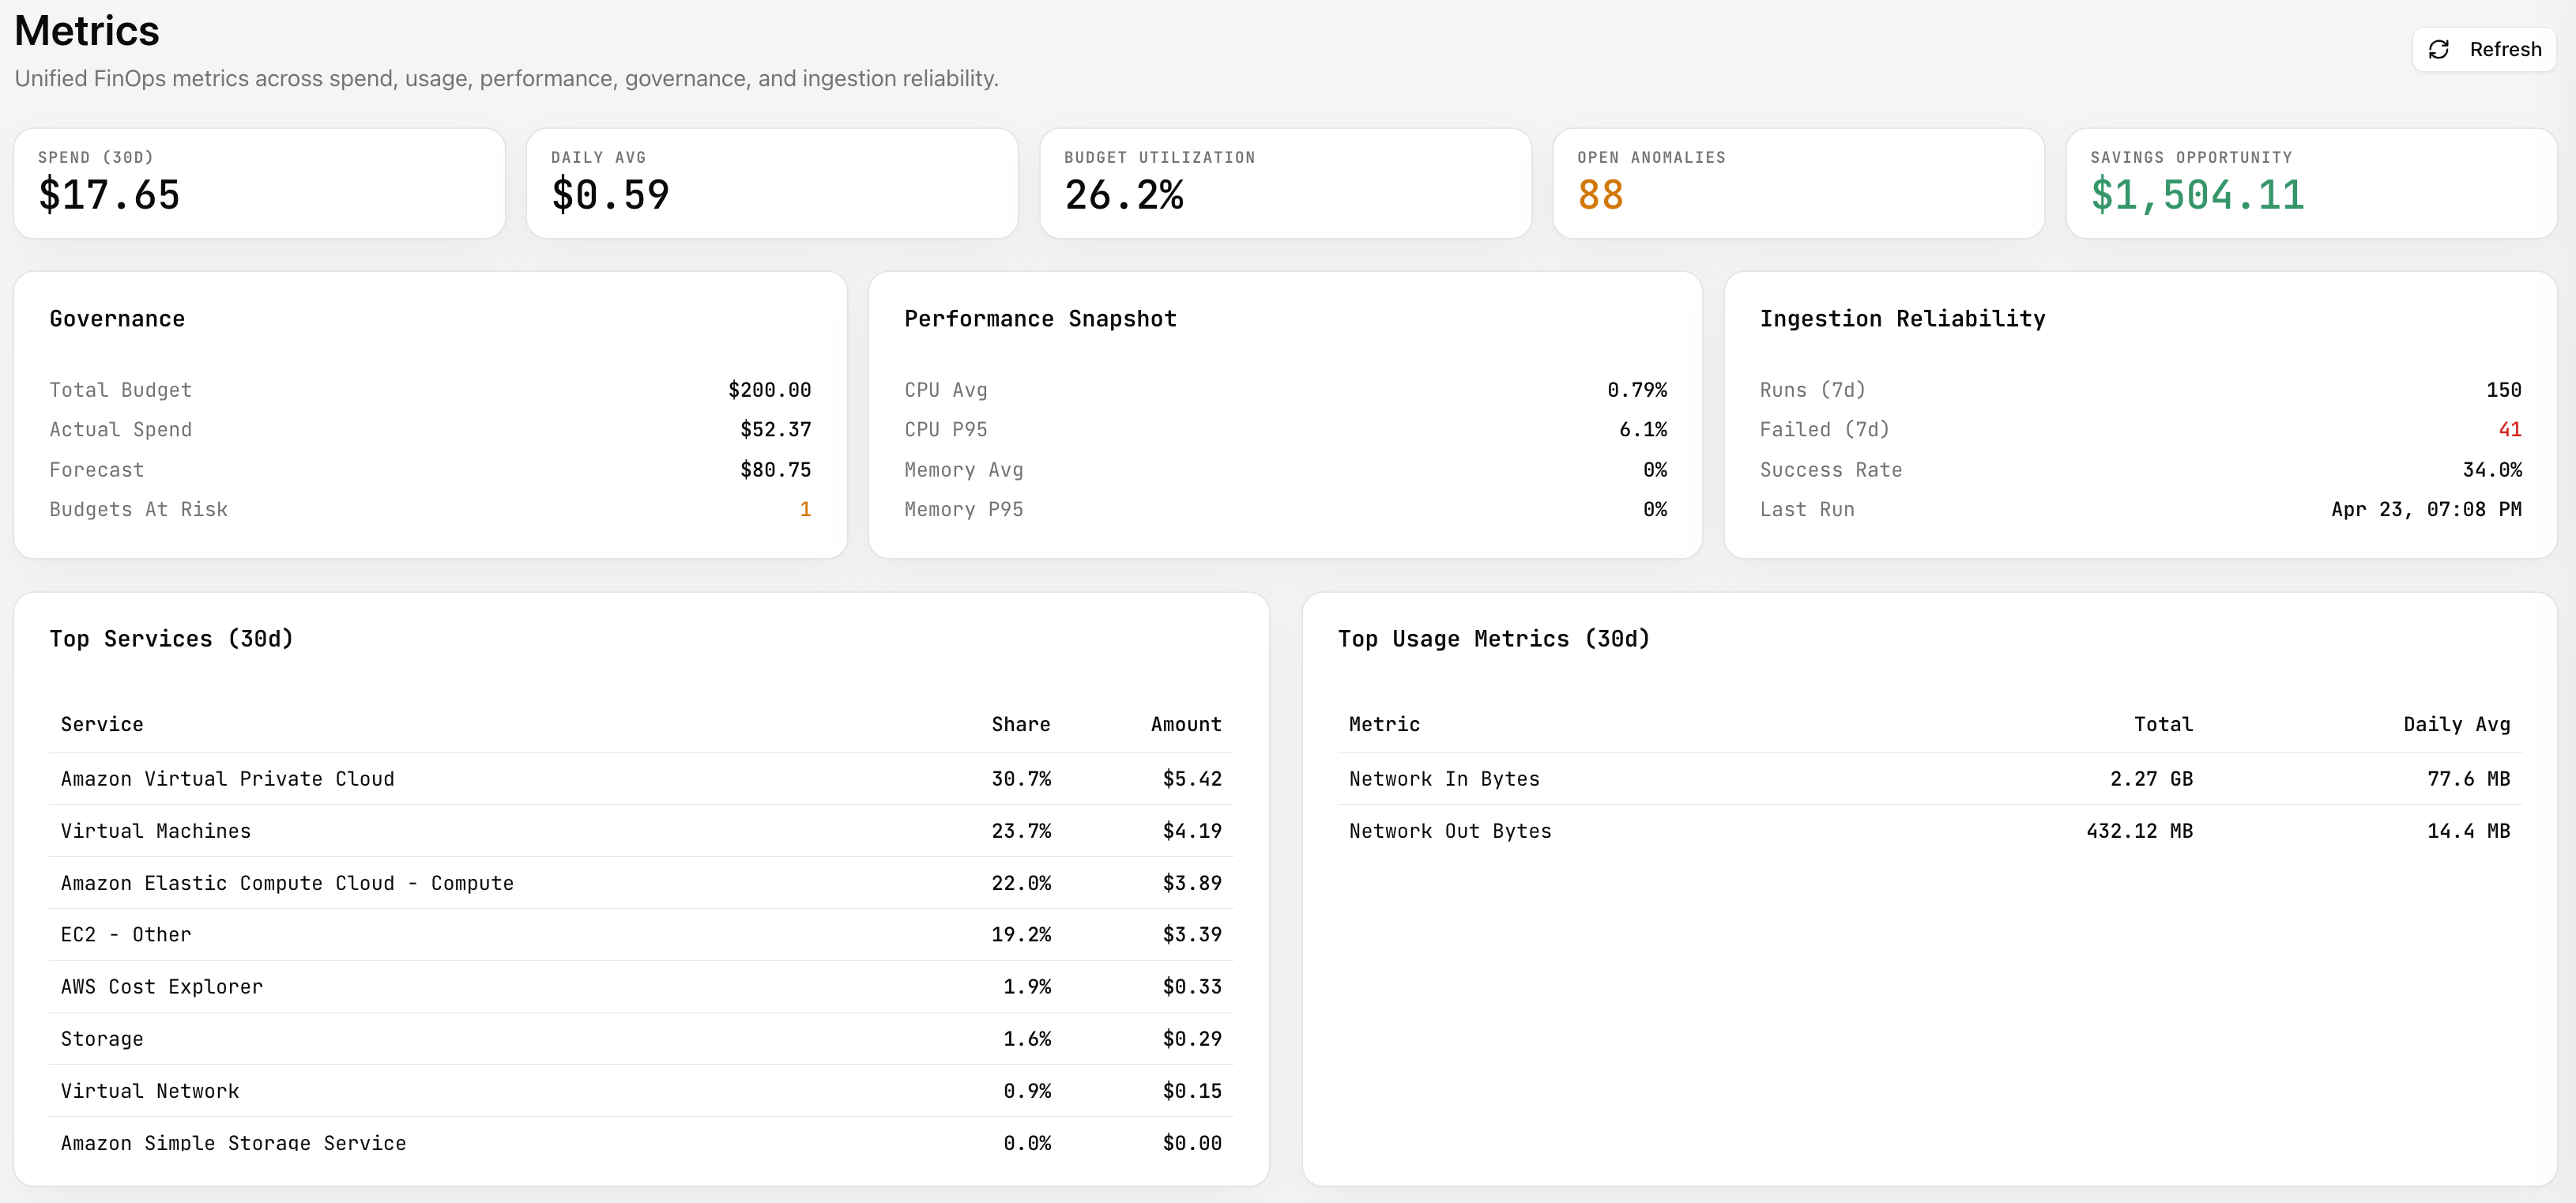
4. Morning loop — Dashboard then drill down
Section titled “4. Morning loop — Dashboard then drill down”Dashboard is the summary: spend, trend, where money goes, and what’s noisy. From here you jump to Metrics for tables and sync, Anomalies for spikes, Budgets for limits—usually in that order when something looks off.
5. When numbers need proof — Metrics
Section titled “5. When numbers need proof — Metrics”Metrics is the deeper sheet: same story as the dashboard but with more breakdowns and a refresh that can pull fresh ingest for your scope. Use it when you’re explaining spend to someone else or after a big infra change.
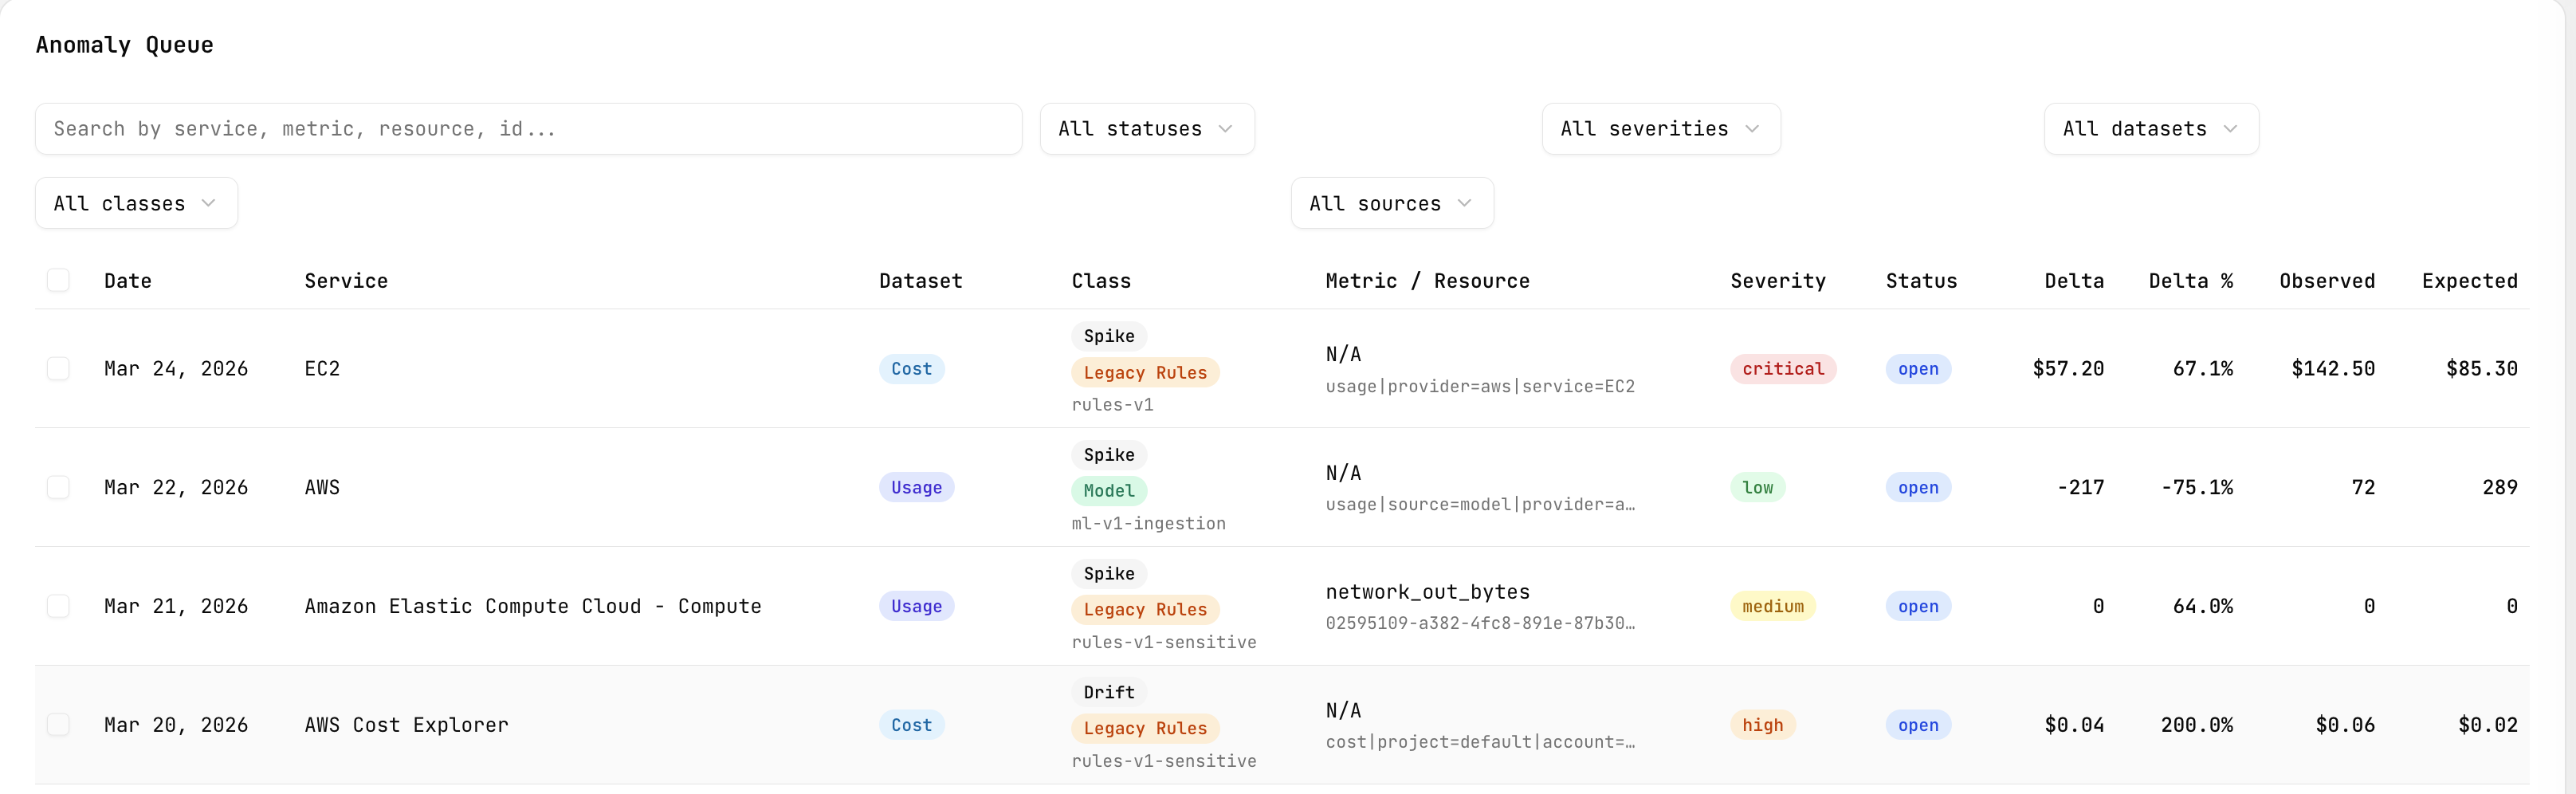
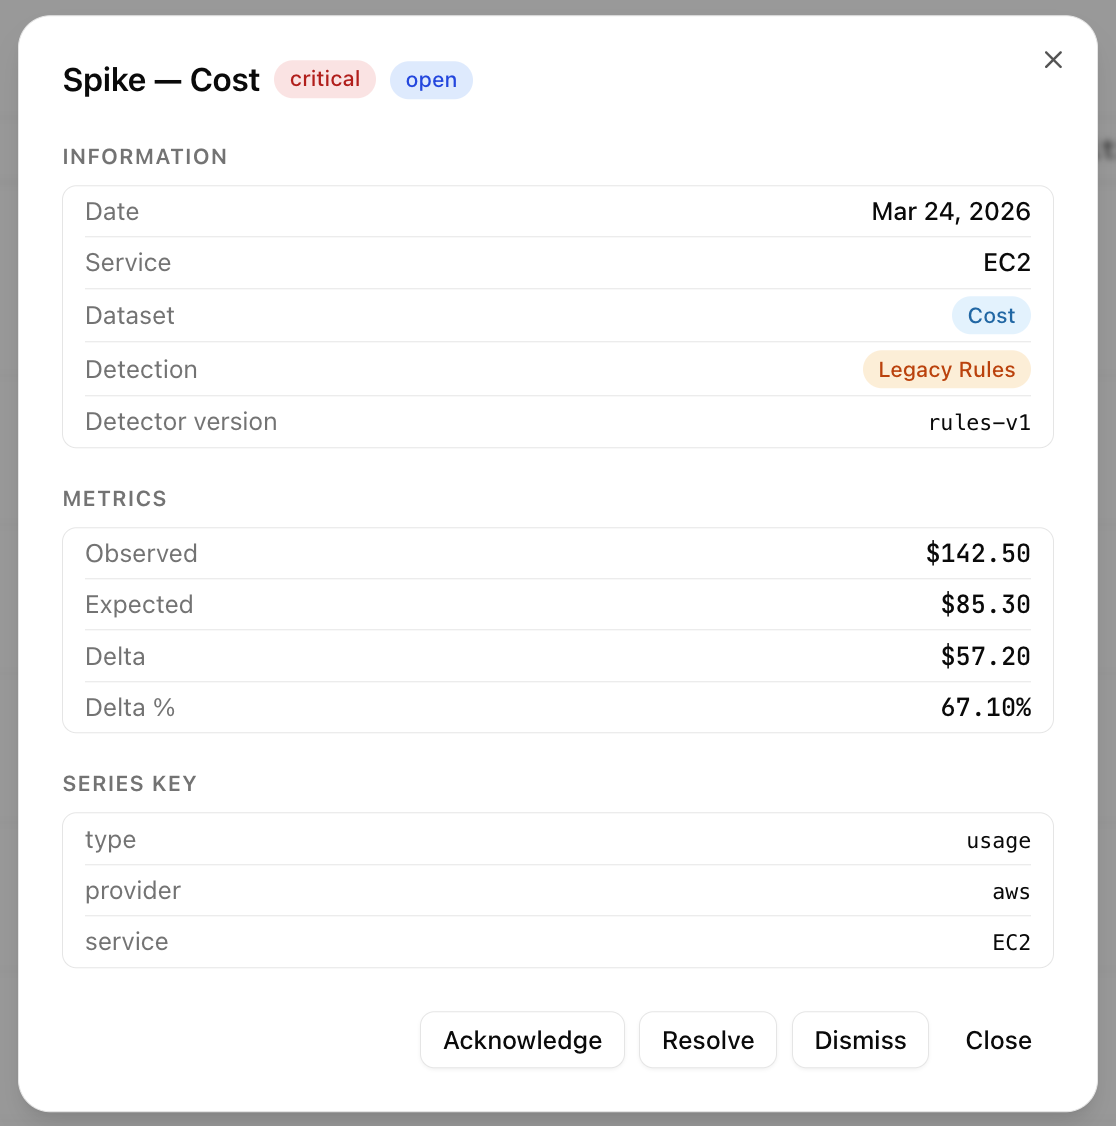
6. When something looks wrong — Anomalies
Section titled “6. When something looks wrong — Anomalies”Anomalies is the triage queue: filter, open a row for detail, move items through open → acknowledged → resolved (or dismiss noise). Bulk actions help when many events share the same story.
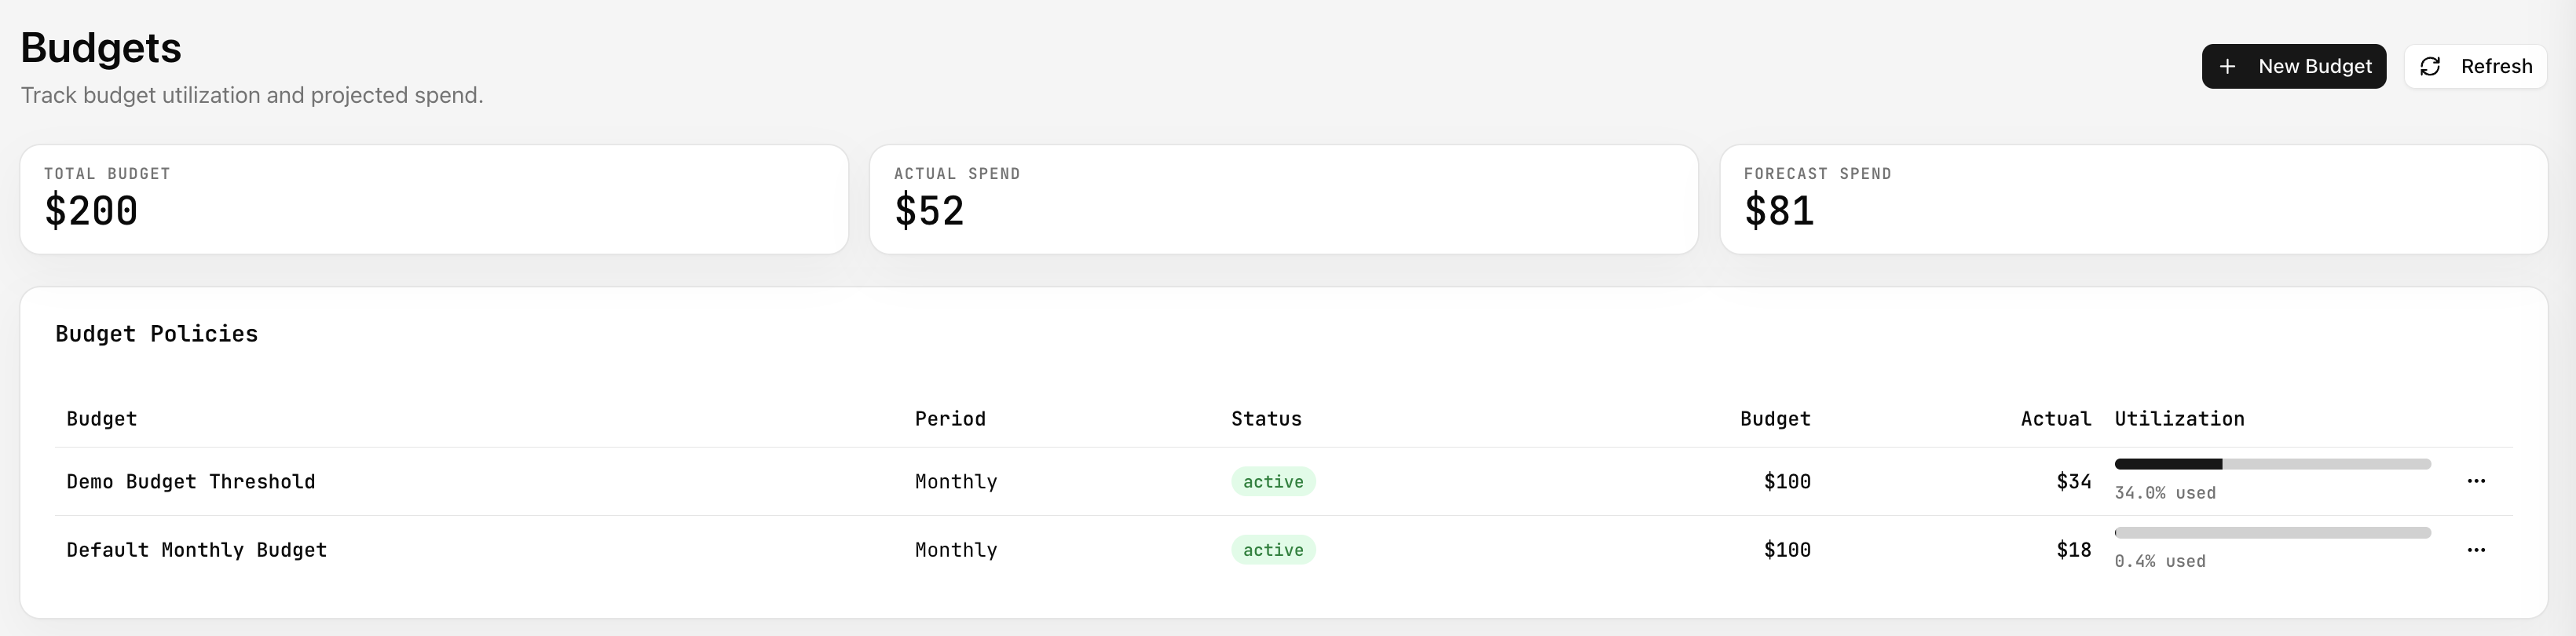
7. Guardrails — Budgets
Section titled “7. Guardrails — Budgets”Budgets is where targets and utilization live: create or edit policies, watch bars move as actuals catch up. Tie this back to Dashboard/Metrics when leadership asks “are we on track?”
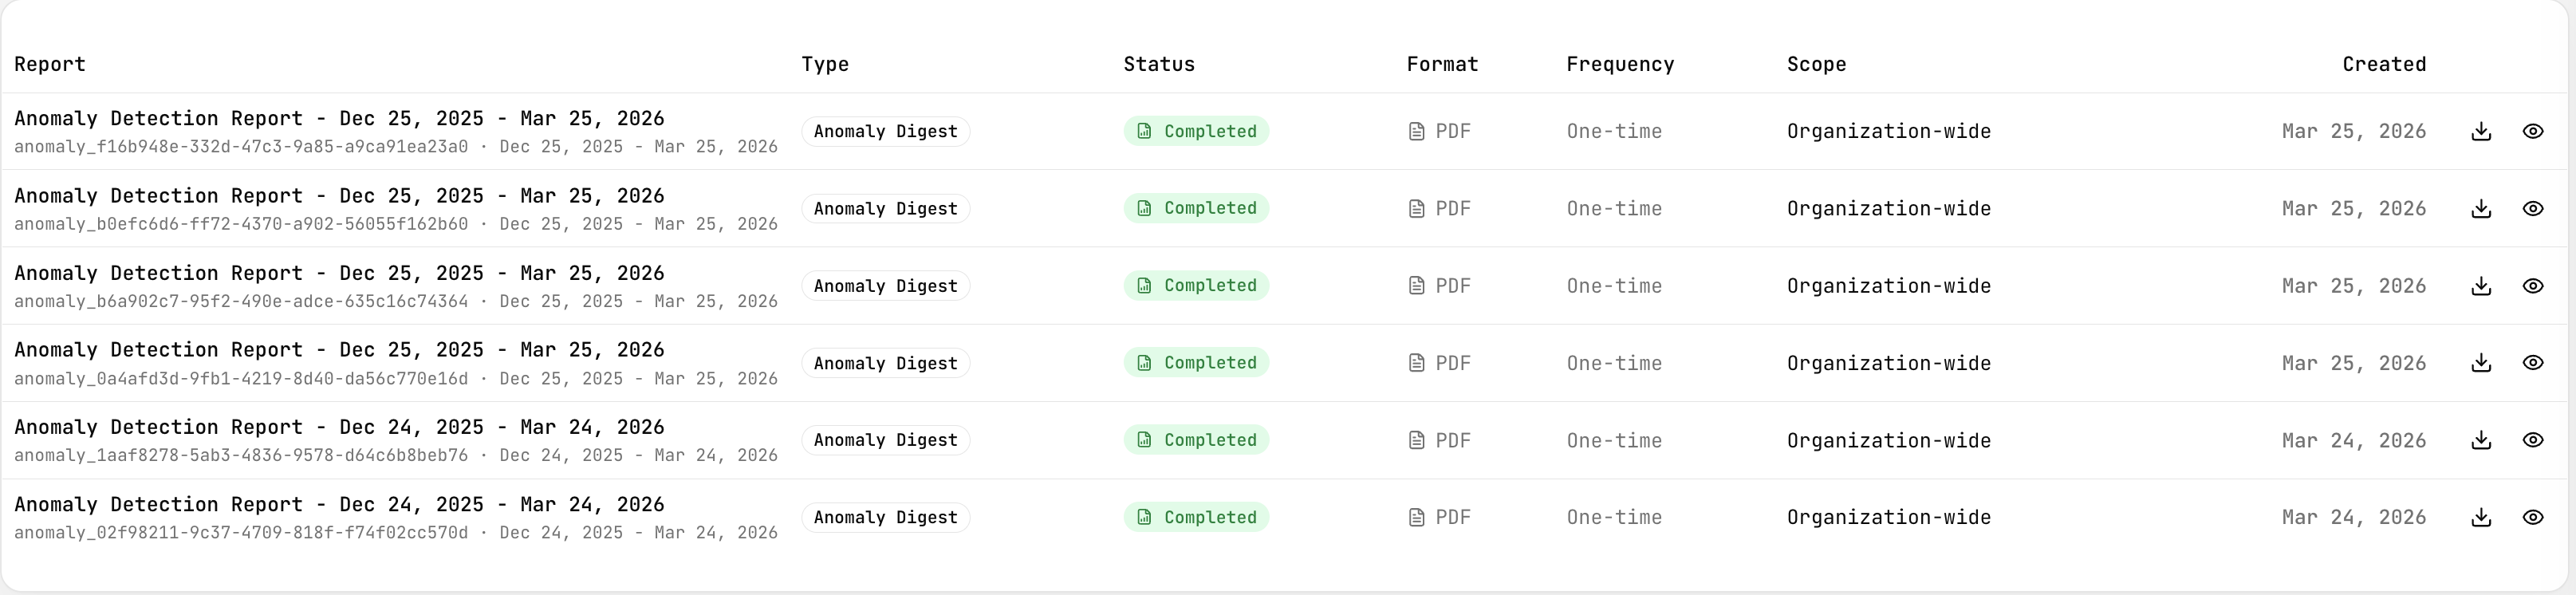
8. Reports (when you need a file or a schedule)
Section titled “8. Reports (when you need a file or a schedule)”Reports is for packaged views—one-off or recurring—so people who don’t live in the app still get the narrative.
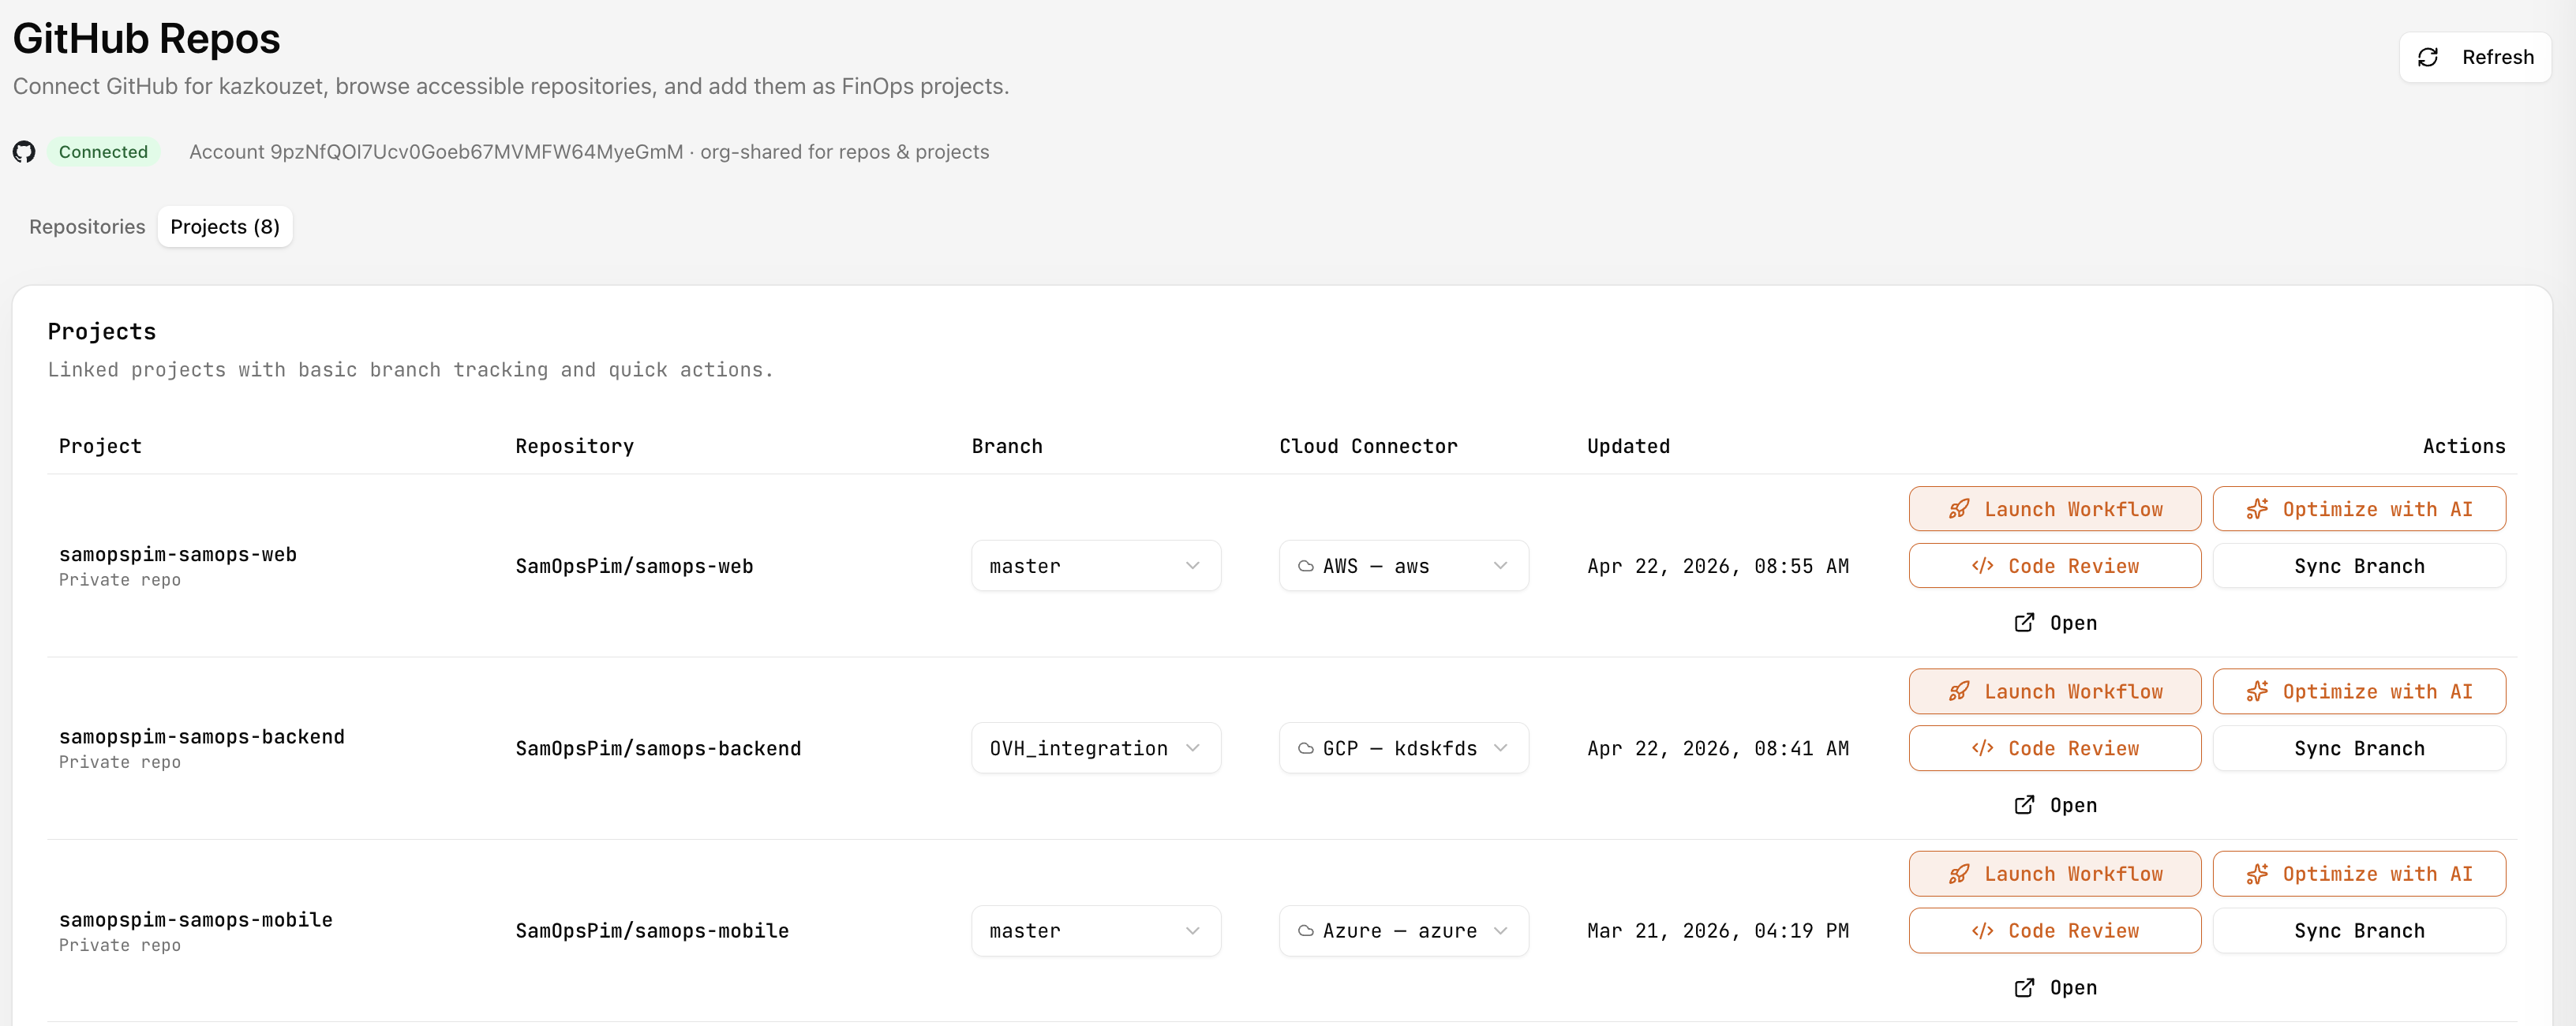
9. Code + cloud — GitHub and workflows
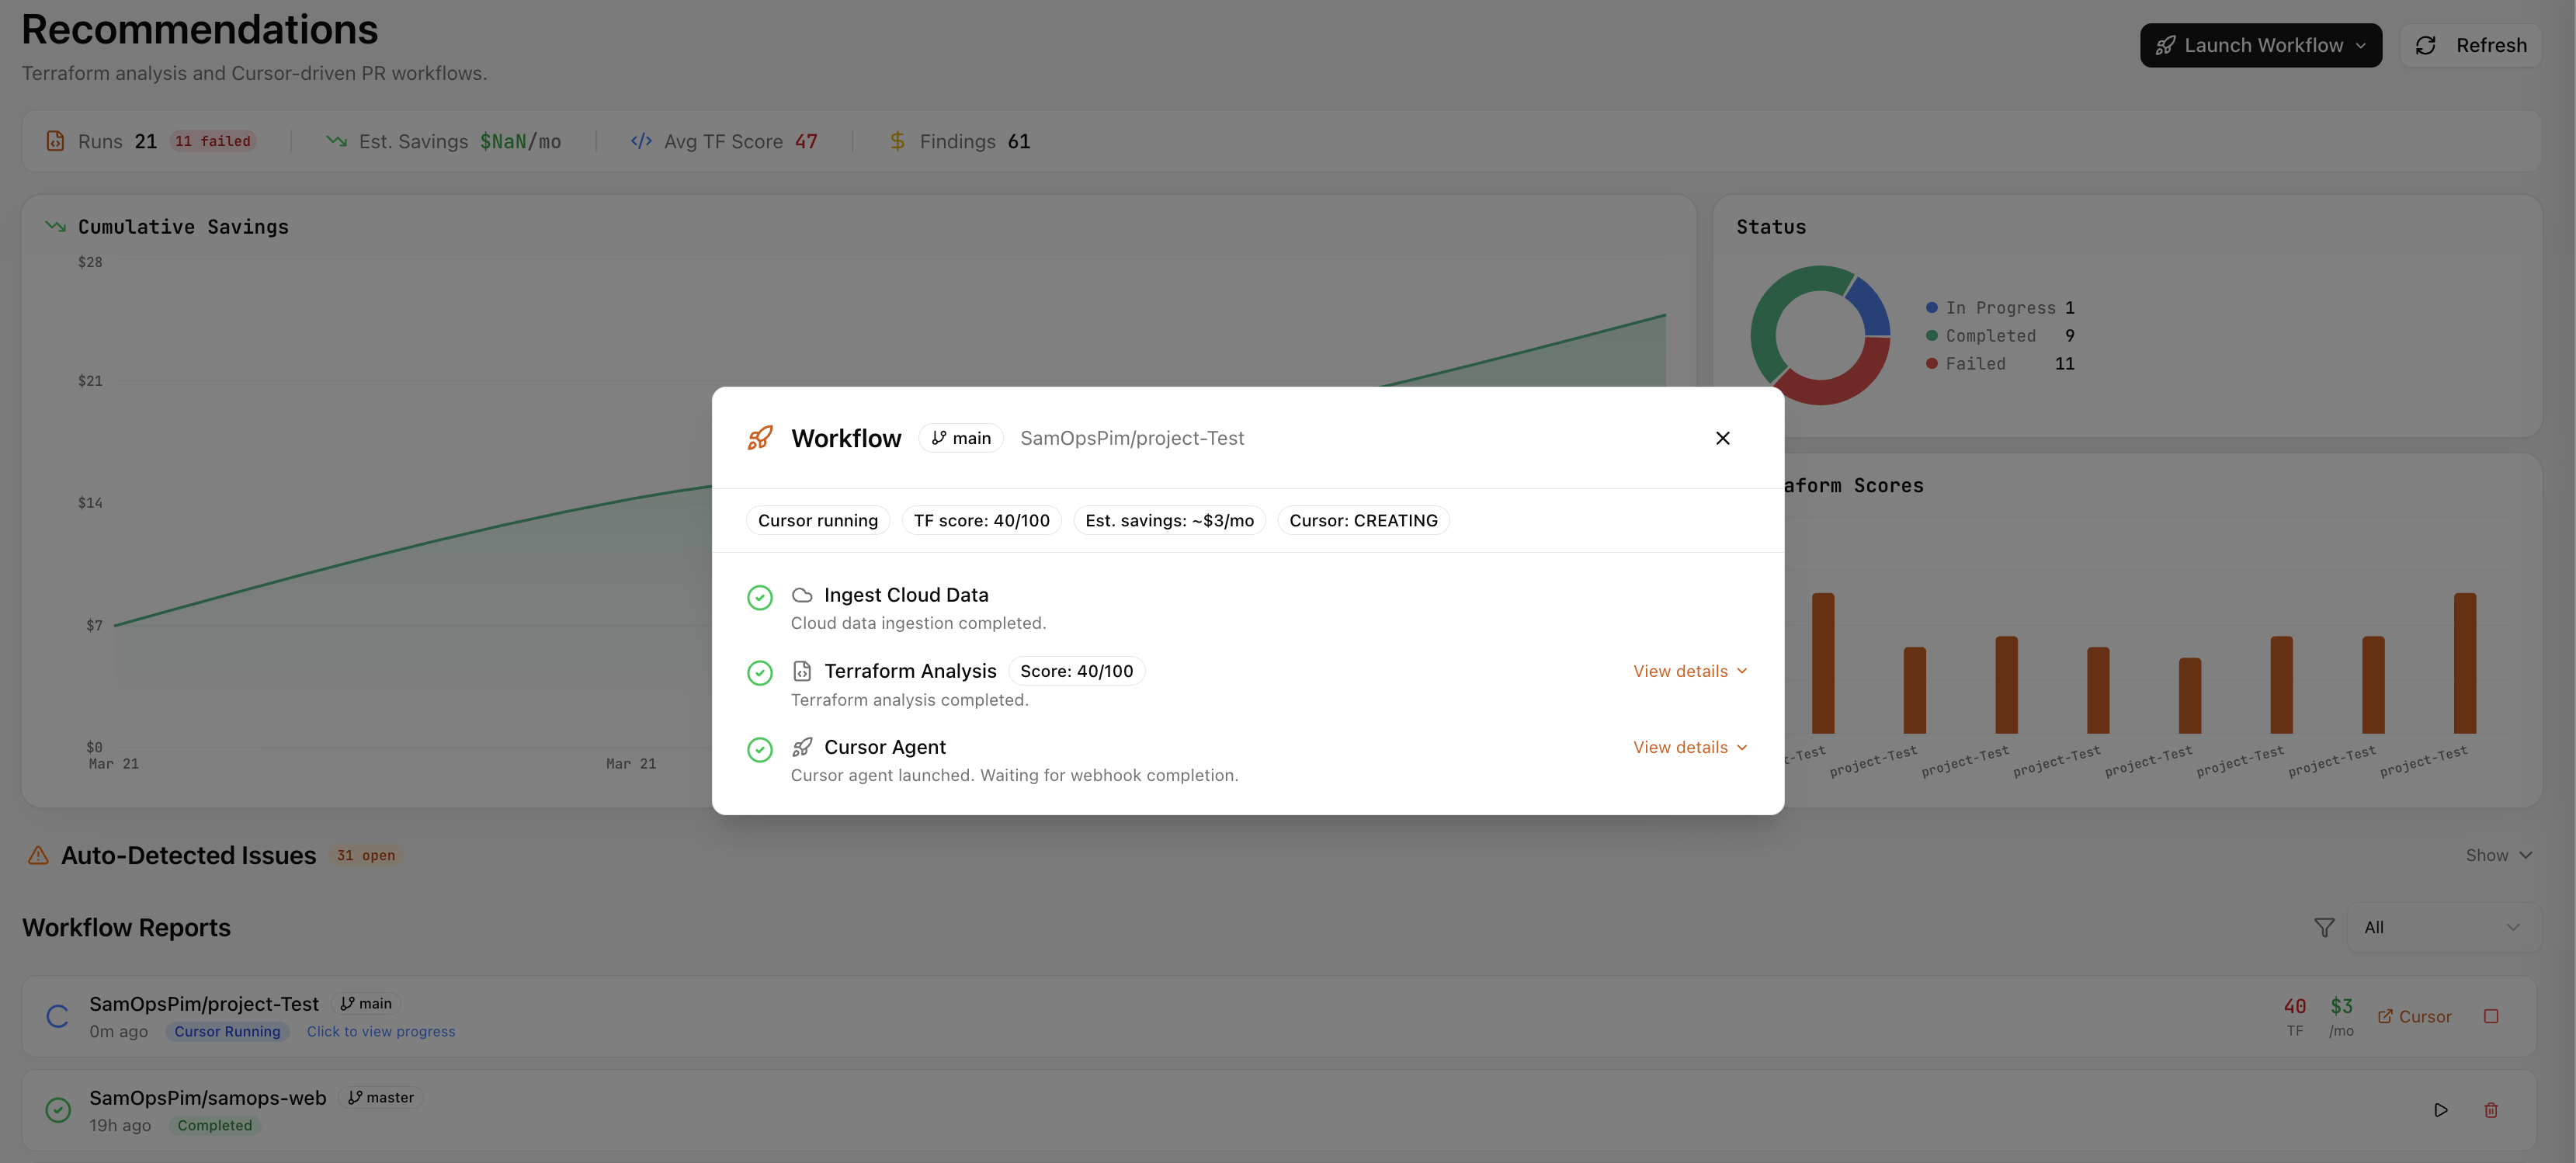
Section titled “9. Code + cloud — GitHub and workflows”Link GitHub under Projects → GitHub Repos, map repos to connectors, pick branches. Then Recommendations (or actions on the repo row) drive workflows—Terraform context plus optional Cursor/PR output—when you want fixes to land as code, not just tickets.
Flow: GitHub linked → repo + branch + connector set → launch workflow → follow stream → open PR link when it appears.
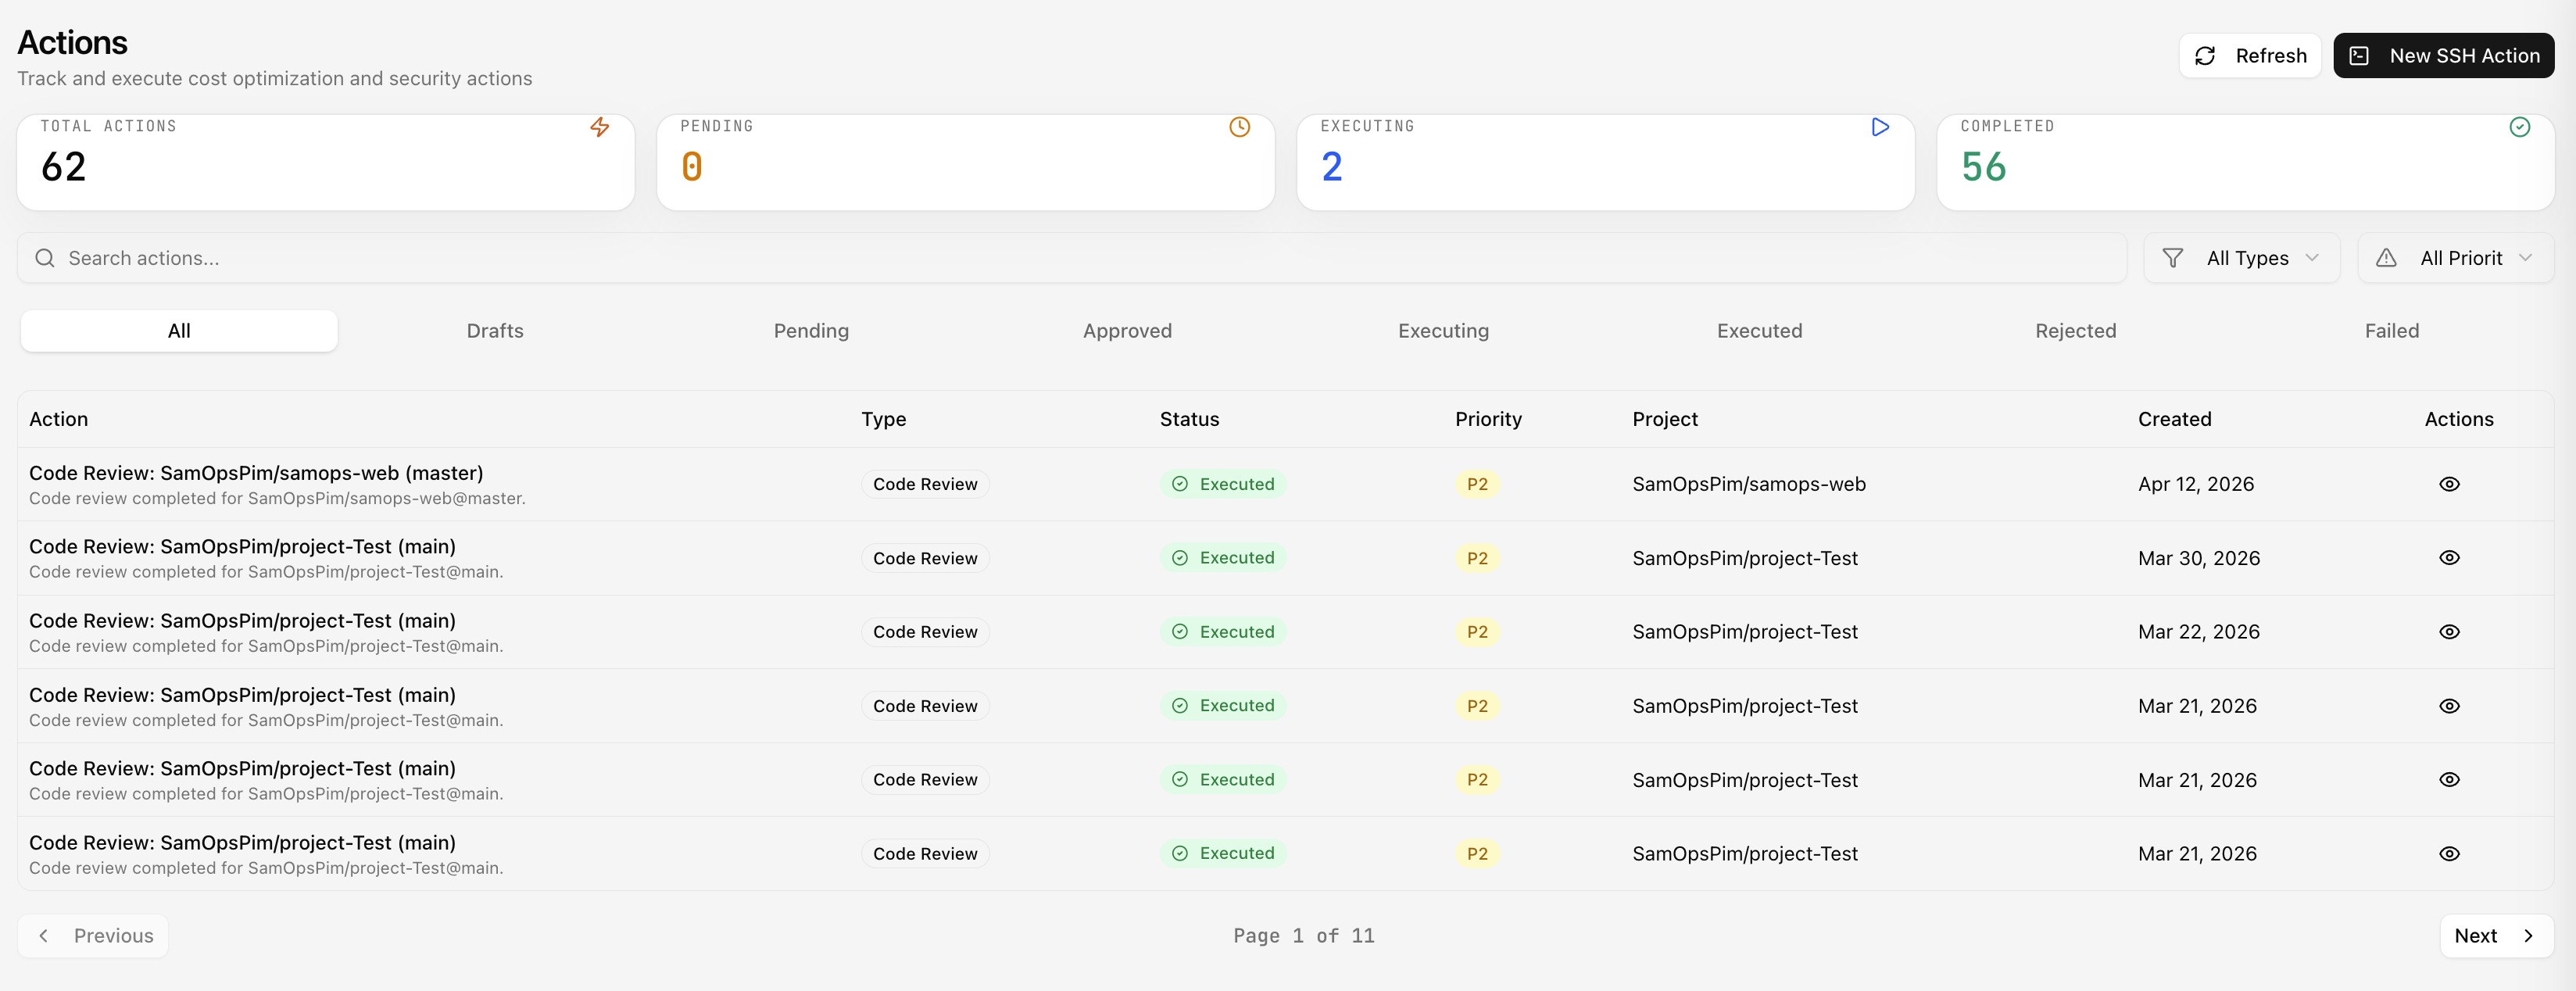
10. Ops actions and SSH (when your process uses them)
Section titled “10. Ops actions and SSH (when your process uses them)”Actions pulls together things that need approval or execution (e.g. SSH-related items, reviews). SSH terminal opens from those flows when your tenant allows it—not every user will see this daily.
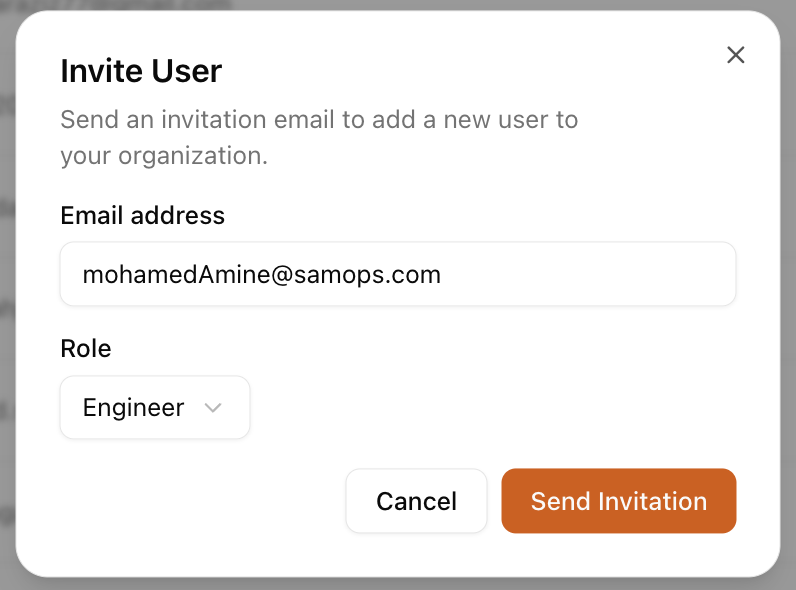
11. Team and audit (admins)
Section titled “11. Team and audit (admins)”Users and invitations: who belongs to the org. Roles (owners/admins): permission matrix. Audit logs: what happened for membership and invites—useful for reviews, not for day-one FinOps.
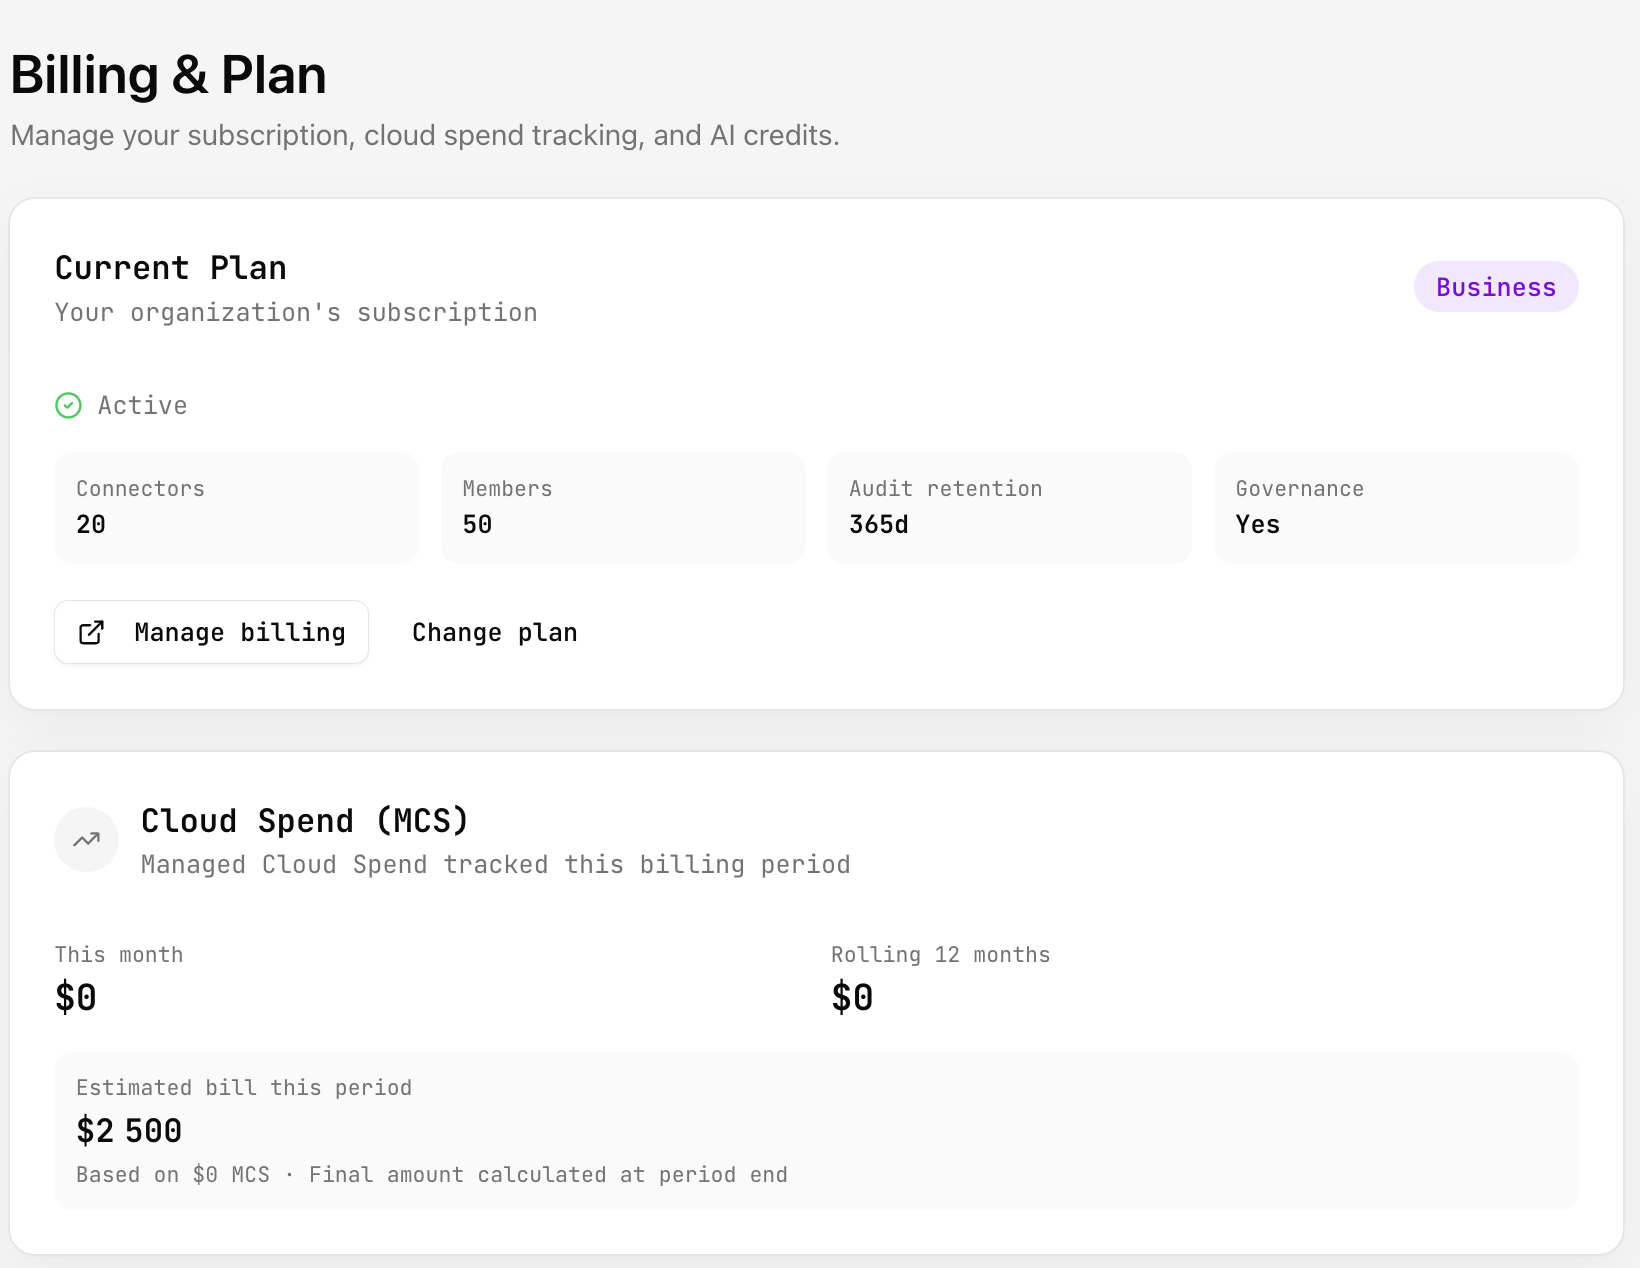
12. Billing and security (as needed)
Section titled “12. Billing and security (as needed)”Billing under the sidebar footer: plan, usage caps, credits. Settings on your avatar and Security route: 2FA and verification. Organization settings from the org menu: org profile, members, invitations, danger zone.
Next: Finding your way in the UI (short) or jump to a section from the sidebar when you already know the flow.