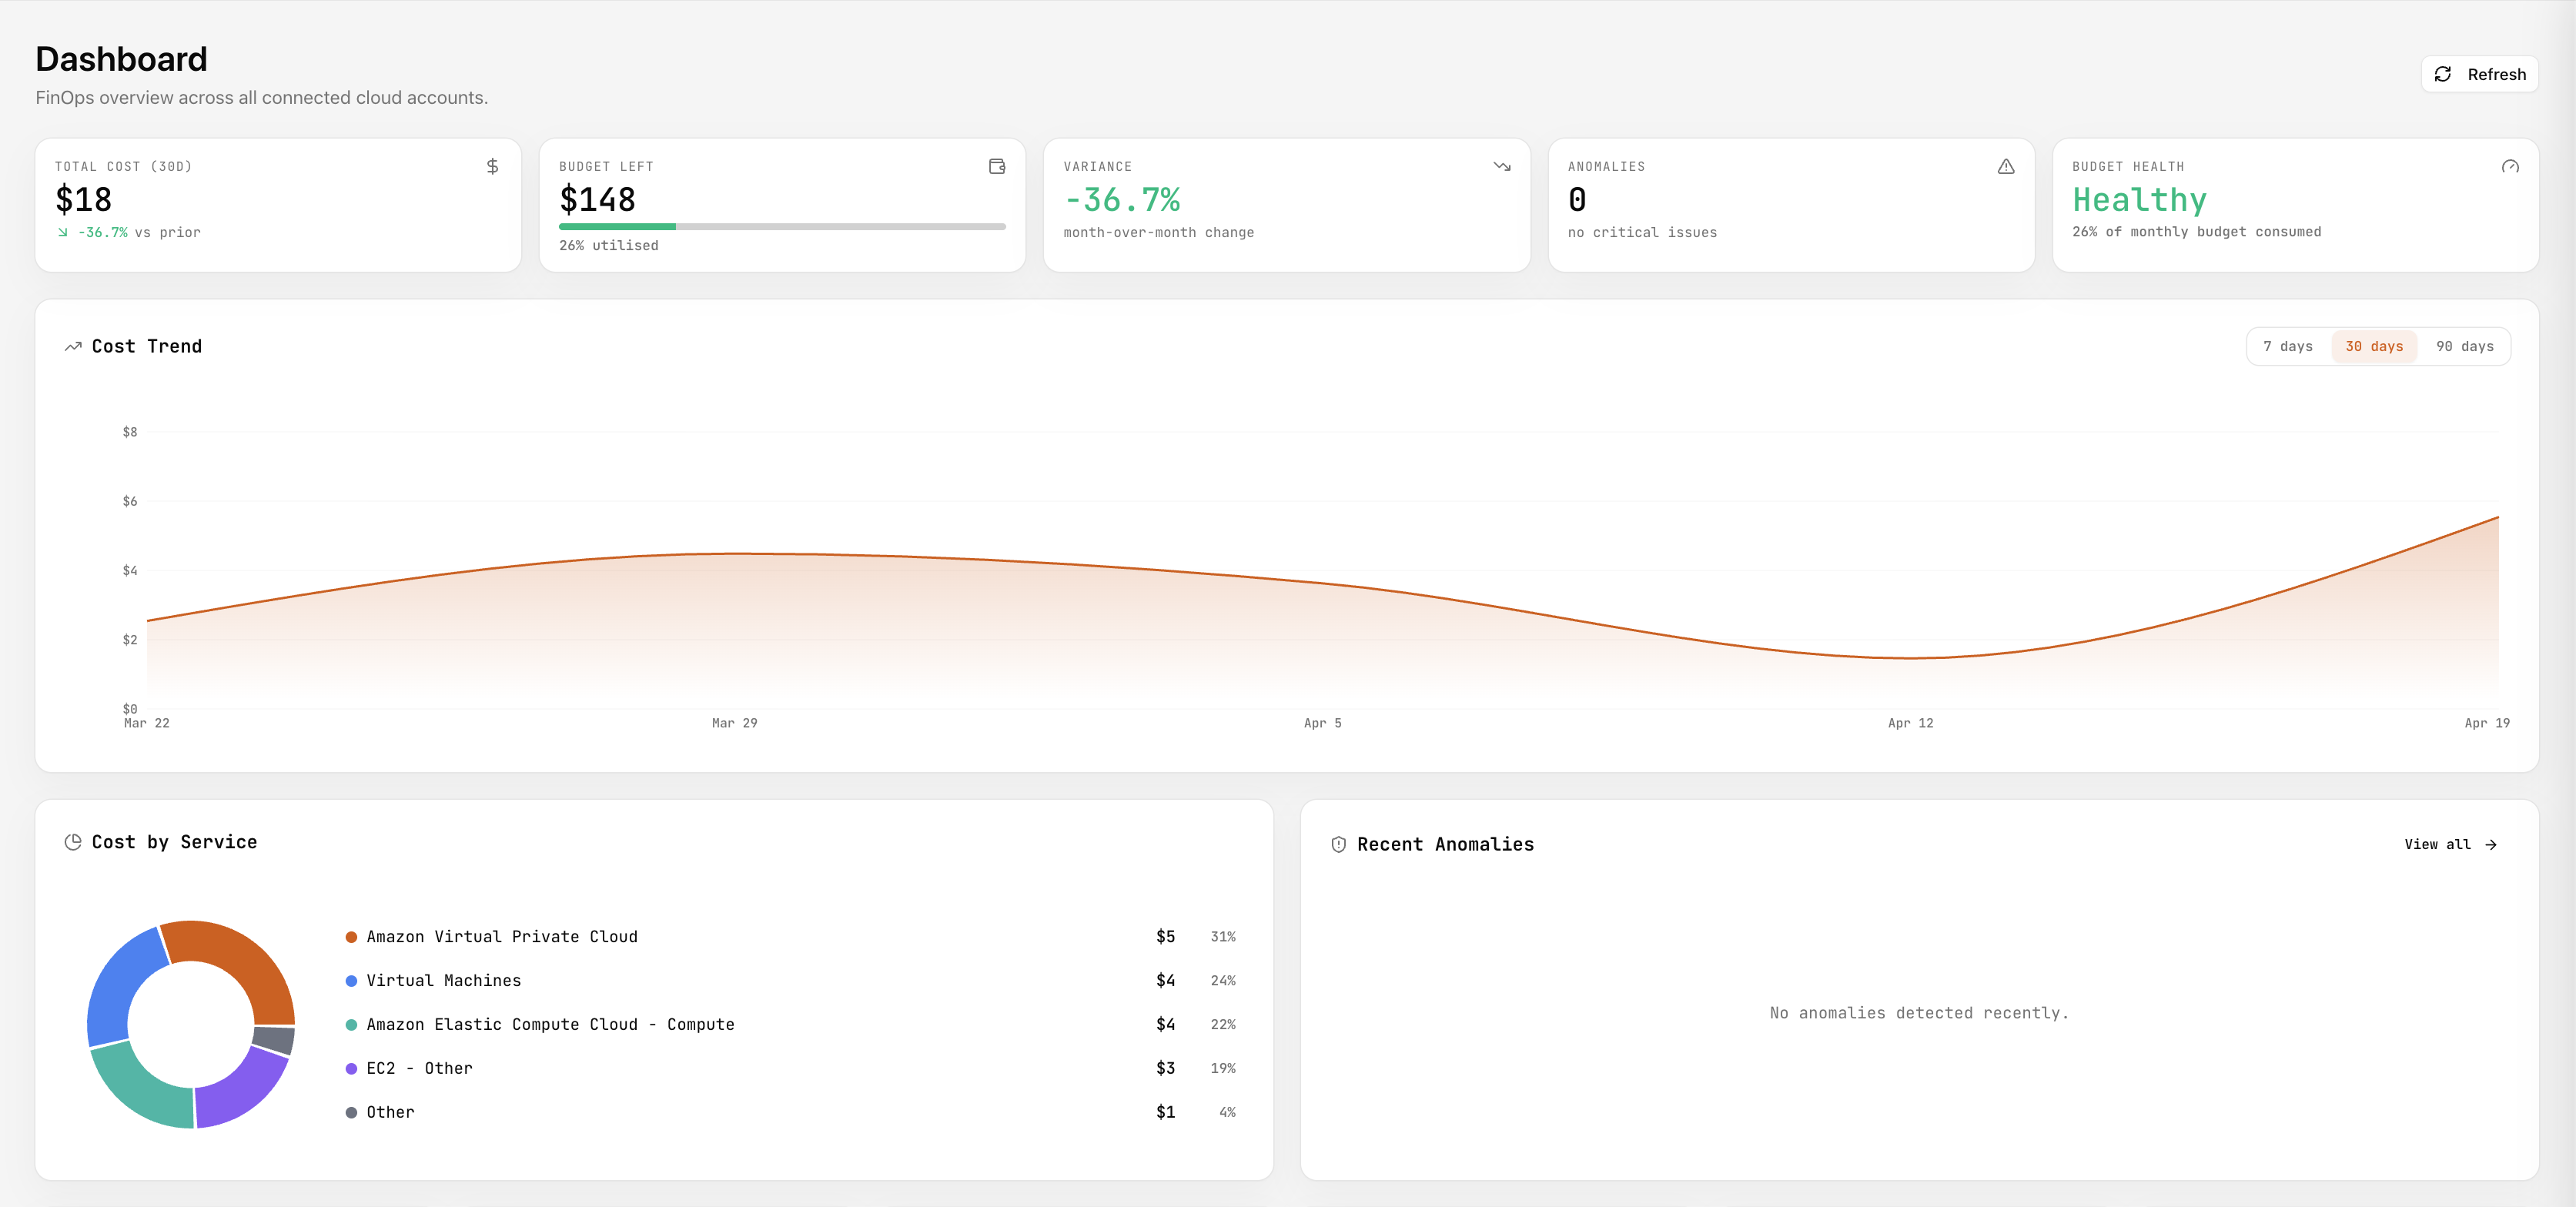
Dashboard
Intent: Answer “how are we doing?” in one scroll: totals, trend, service mix, recent spikes, shortcuts deeper.
Typical flow: Land here → scan alerts → open Metrics or Anomalies if something’s red → use quick links to Connectors or Budgets when the issue is setup or limits.